#Данные
#Визуализация
#Инфографика
Edward R. Tufte
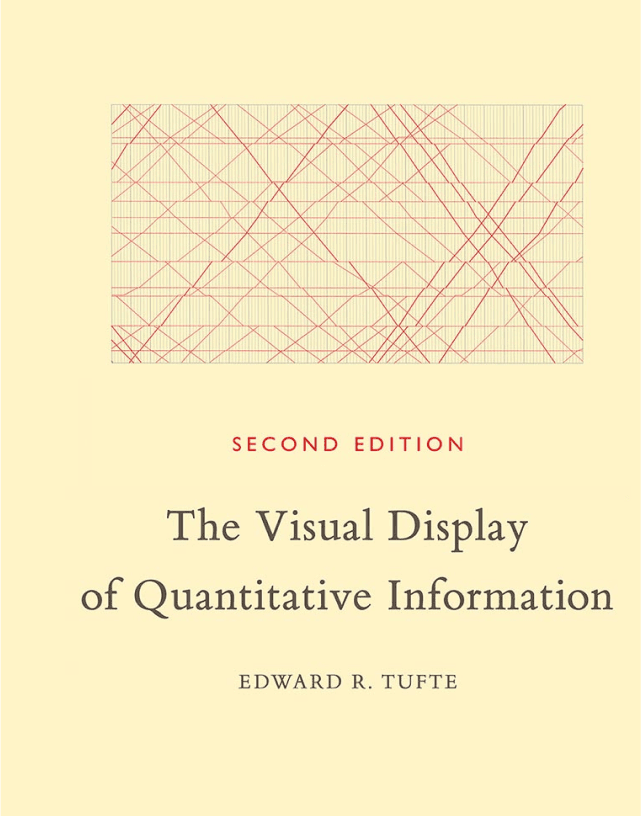
The Visual Display of Quantitative Information
The Visual Display of Quantitative Information
Издательство
Страниц
197
Язык издания
Английский
Печатный экземпляр
Есть, можно взять
Страниц
Нет
197
Язык издания
Нет
Английский
Печатный экз.
Есть, можно взять
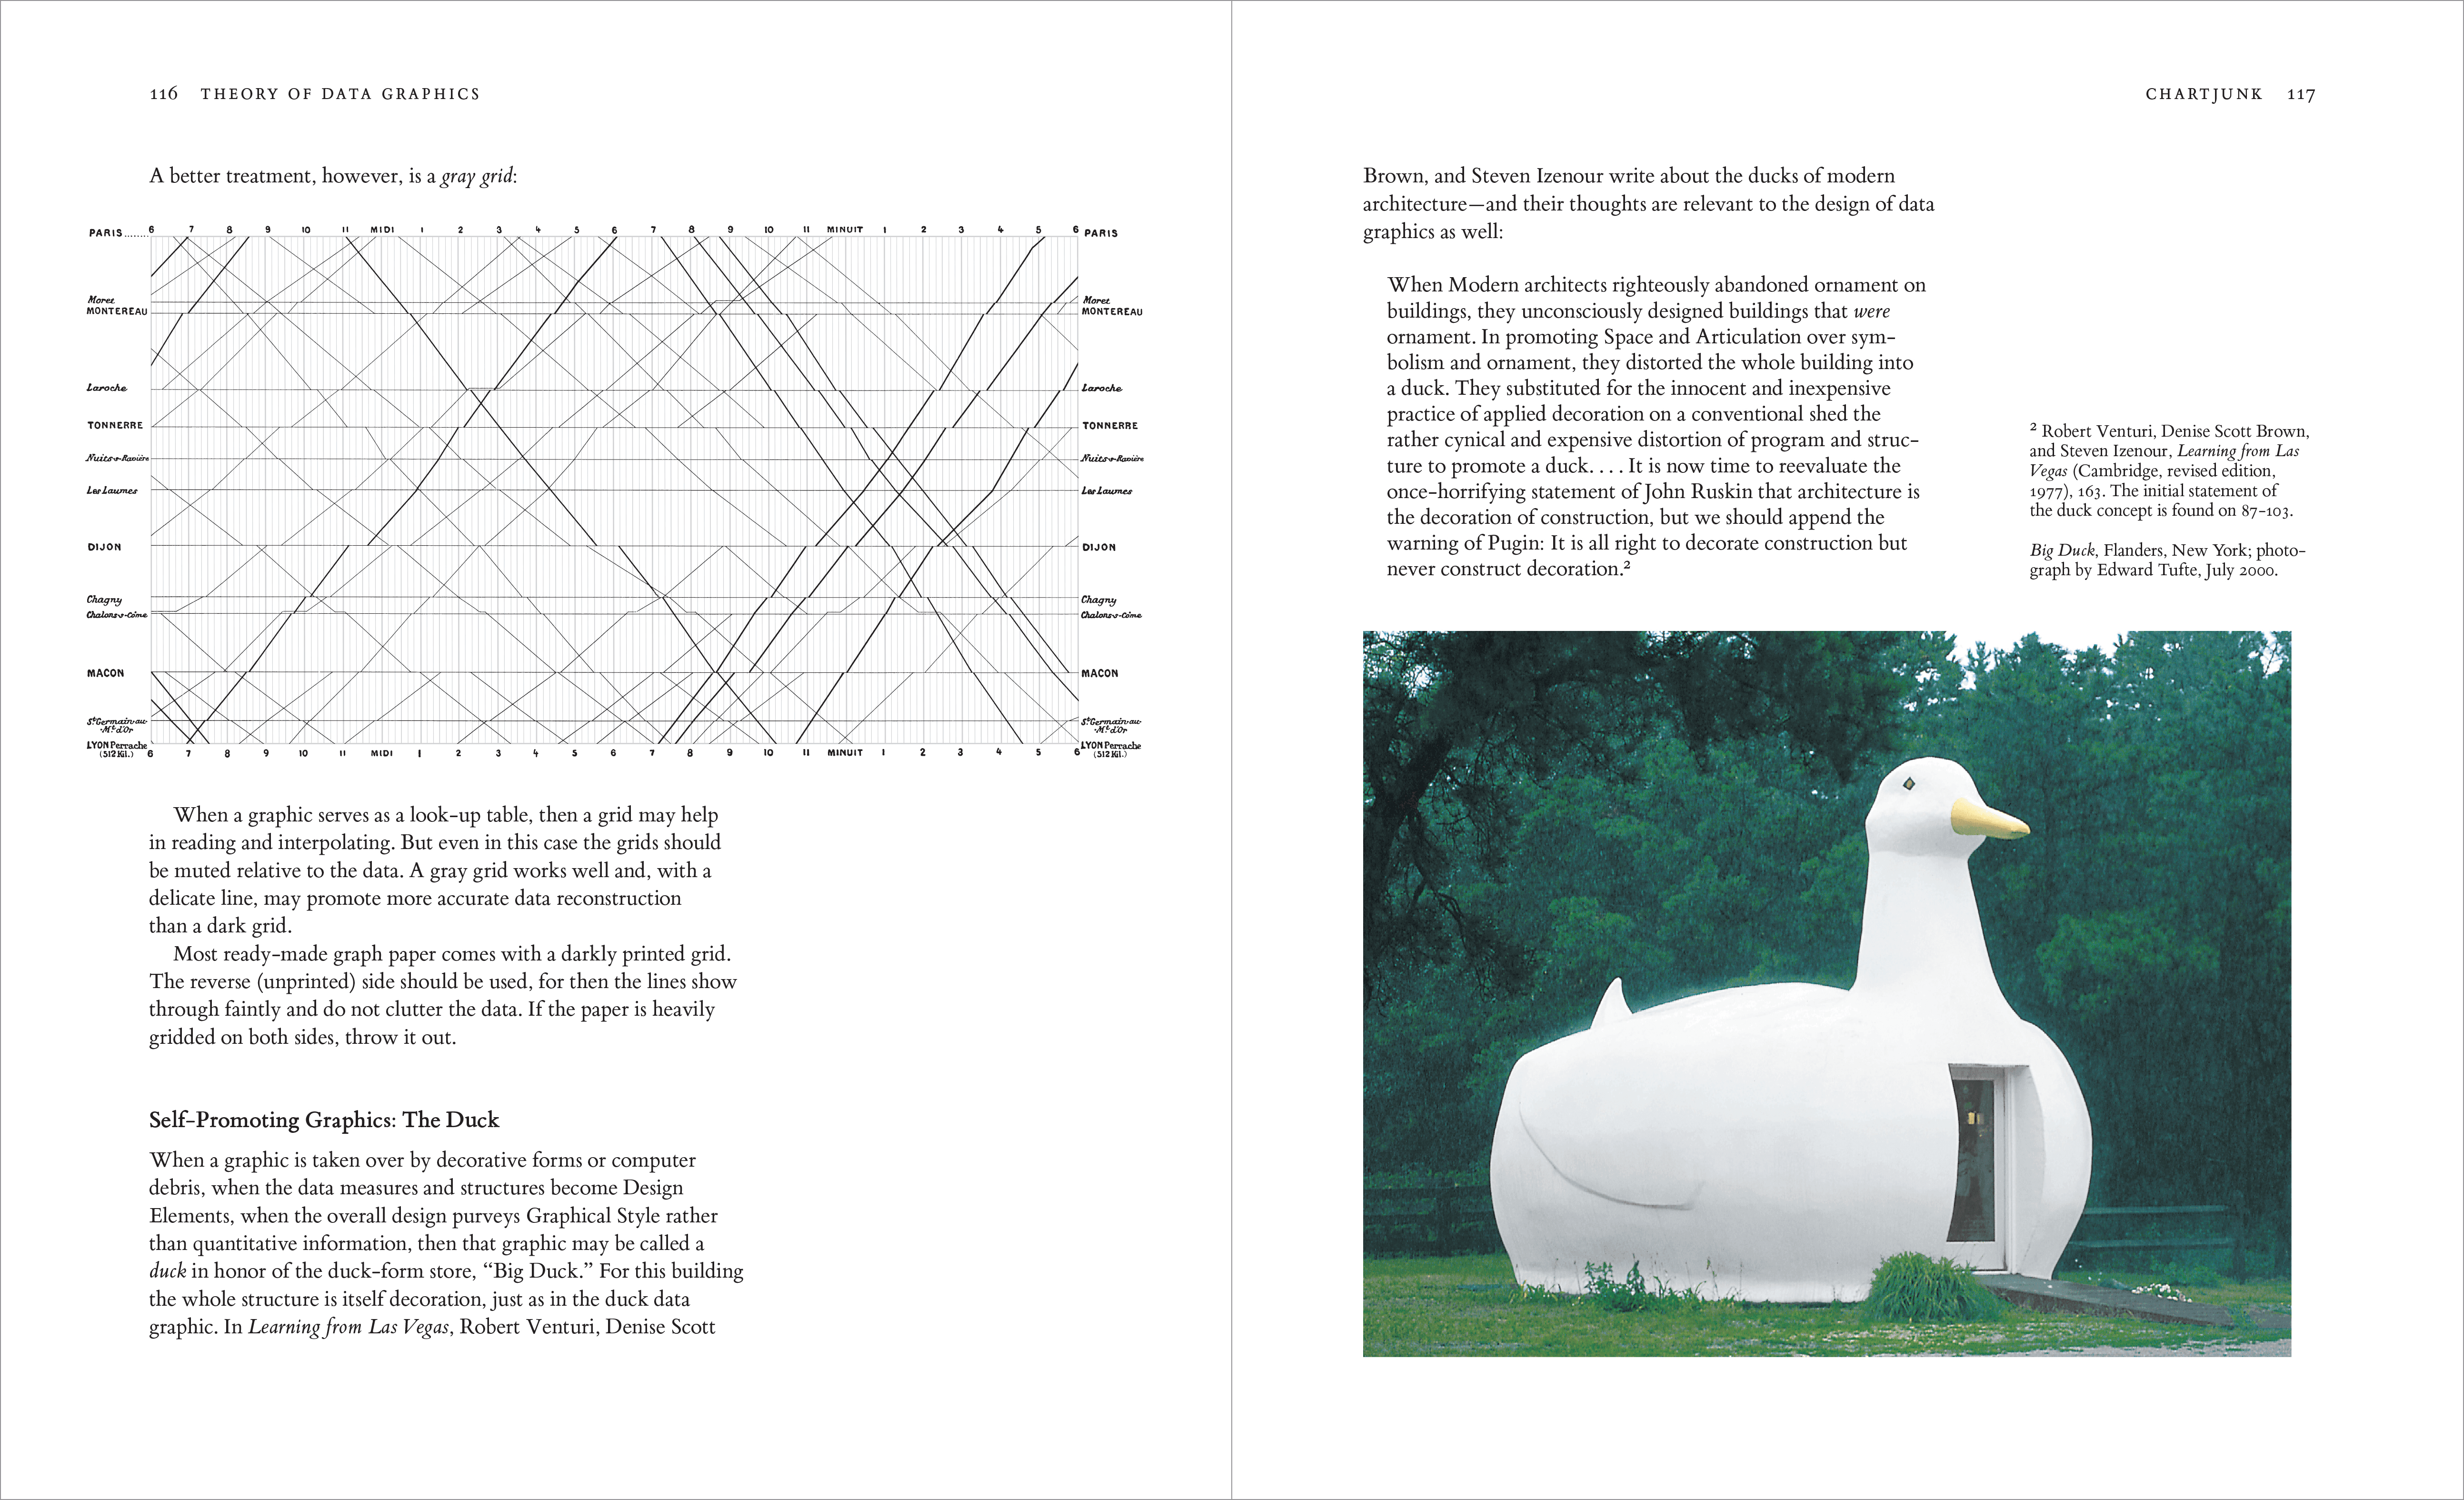

The classic book on statistical graphics, charts, tables. Theory and practice in the design of data graphics, 250 illustrations of the best (and a few of the worst) statistical graphics, with detailed analysis of how to display data for precise, effective, quick analysis. Design of the high-resolution displays, small multiples. Editing and improving graphics. The data-ink ratio. Time-series, relational graphics, data maps, multivariate designs. Detection of graphical deception: design variation vs. data variation. Sources of deception. Aesthetics and data graphical displays.
This is the second edition of The Visual Display of Quantitative Information. Recently published, this new edition provides excellent color reproductions of the many graphics of William Playfair, adds color to other images, and includes all the changes and corrections accumulated during 17 printings of the first edition.
Аннотация

Edward R. Tufte
Edward R. Tufte
Эдвард Тафти — американский профессор, писатель, художник и эксперт в области визуализации данных. Получил образование в Стэнфорде и Йельском университете, преподавал в Принстоне и Йеле. Известен своими работами о дизайне и представлении данных, включая книги «Визуальное представление количественной информации» (The Visual Display of Quantitative Information), «Прекрасные доказательства» (Beautiful Evidence) и «Визуальные объяснения» (Visual Explanations). Его труды оказали огромное влияние на науку, бизнес и искусство, а также заложили основу для современных подходов к анализу и визуализации информации.

The classic book on statistical graphics, charts, tables. Theory and practice in the design of data graphics, 250 illustrations of the best (and a few of the worst) statistical graphics, with detailed analysis of how to display data for precise, effective, quick analysis. Design of the high-resolution displays, small multiples. Editing and improving graphics. The data-ink ratio. Time-series, relational graphics, data maps, multivariate designs. Detection of graphical deception: design variation vs. data variation. Sources of deception. Aesthetics and data graphical displays.
This is the second edition of The Visual Display of Quantitative Information. Recently published, this new edition provides excellent color reproductions of the many graphics of William Playfair, adds color to other images, and includes all the changes and corrections accumulated during 17 printings of the first edition.
Edward R. Tufte
Edward R. Tufte
Эдвард Тафти — американский профессор, писатель, художник и эксперт в области визуализации данных. Получил образование в Стэнфорде и Йельском университете, преподавал в Принстоне и Йеле. Известен своими работами о дизайне и представлении данных, включая книги «Визуальное представление количественной информации» (The Visual Display of Quantitative Information), «Прекрасные доказательства» (Beautiful Evidence) и «Визуальные объяснения» (Visual Explanations). Его труды оказали огромное влияние на науку, бизнес и искусство, а также заложили основу для современных подходов к анализу и визуализации информации.
Аннотация